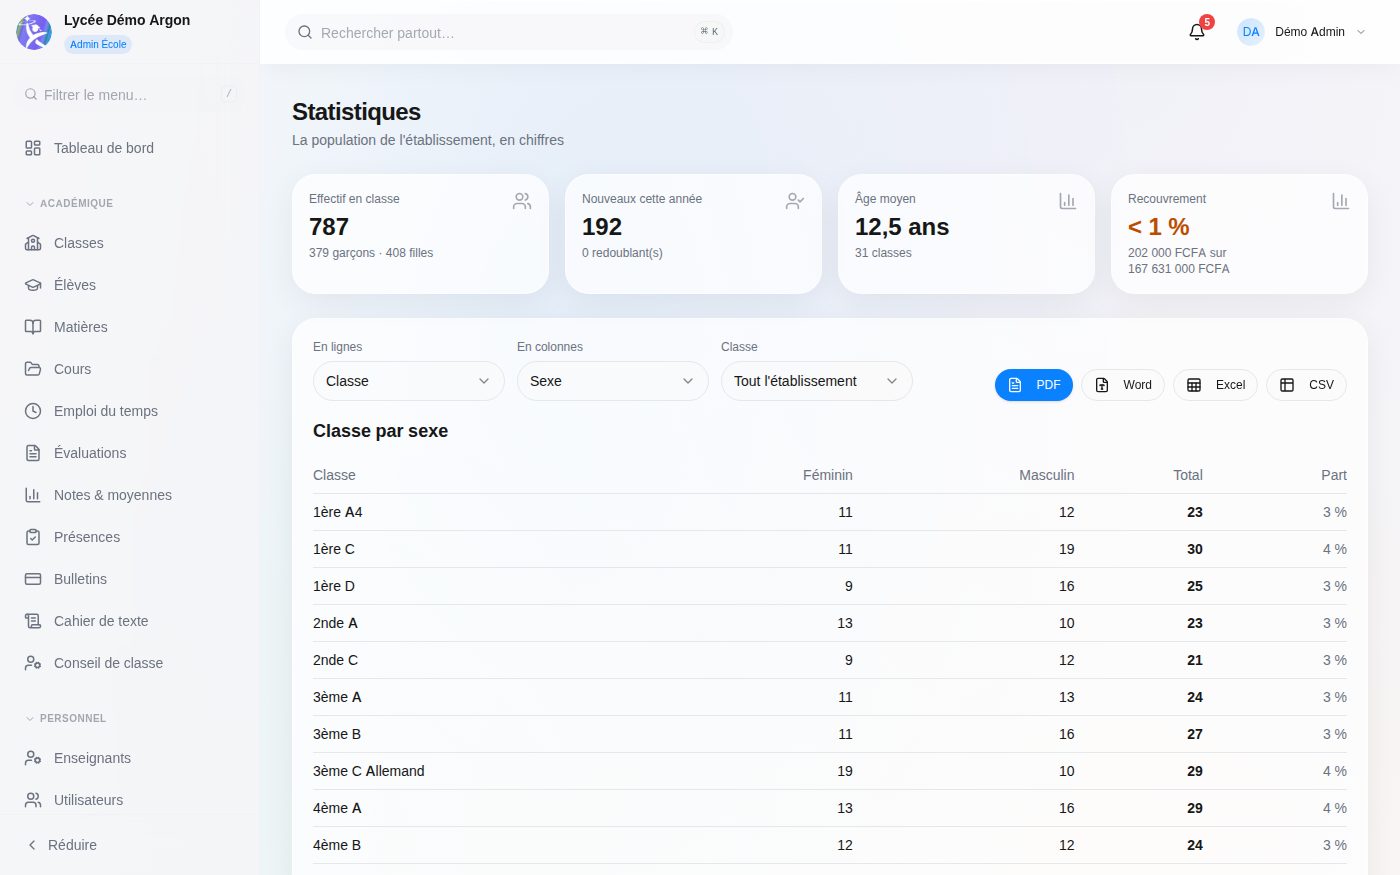
Enrolment, attendance, academic results, collection rate: the figures that decide your year sit on one screen and update themselves. You compare classes, terms and school years, and you take a decision on what the establishment actually recorded.
Real-time overview of all key school indicators.
Bar charts, pie charts, trend lines with dynamic filters.
Averages by class/subject, success rates, grade distribution.
Attendance rates, absenteeism trends, class comparison.
Recovery rates, monthly revenue, budget forecasts.
Download reports as PDF, Excel or CSV for sharing.
The figures that decide your year, on one screen
Classes, terms and school years compared
Figures update themselves as data is entered
Decisions rest on what was actually recorded
30-day free trial. No credit card required. Access to all modules.
Start your 30-day free trial. No credit card required. Dedicated support included.